Generic Component Logs
- Under this we cover log exploration for generic components such as API, UI, MongoDB, PostgreSQL, Monitoring components
- For these components there are 2 ways to explore the logs
- Directly opening the AWS Cloudwatch Log Stream and viewing the logs there
- Exploration via AWS Cloudwatch Insights by querying the logs
- In both the cases, it's best to determine the log stream to look the logs in
Identifying Log Streams
The log groups are determined by the namespace the component is deployed in.
| Component | Namespace | Log Group Name | Log Stream Name | Metadata |
|---|---|---|---|---|
| API | default | /dynamofl/application-logs/eks-cluster/default | api.${POD_NAME} | POD_NAME: starts with api-deployment-* |
| UI | default | /dynamofl/application-logs/eks-cluster/default | ui.${POD_NAME} | POD_NAME: starts with api-deployment-* |
| MongoDB | mongodb | /dynamofl/application-logs/eks-cluster/mongodb | mongodb.${POD_NAME} | POD_NAME: starts with mongodb-* |
| PostgreSQL | postgresql | /dynamofl/application-logs/eks-cluster/postgresql | postgres.${POD_NAME} | POD_NAME: starts with postgres-deployment-* |
| OpenTelemetry | opentelemetry | /dynamofl/application-logs/eks-cluster/opentelemetry | opentelemetry-collector.${POD_NAME} | POD_NAME: starts with opentelemetry-collector-* |
| Prometheus | monitoring | /dynamofl/application-logs/eks-cluster/monitoring | prometheus-server.${POD_NAME} | POD_NAME: starts with prometheus-* |
| Grafana | monitoring | /dynamofl/application-logs/eks-cluster/monitoring | grafana.${POD_NAME} | POD_NAME: starts with grafana-* |
| Alertmanager | monitoring | /dynamofl/application-logs/eks-cluster/monitoring | alertmanager.${POD_NAME} | POD_NAME: starts with alertmanager-* |
| EventExporter | monitoring | /dynamofl/application-logs/eks-cluster/monitoring | event-exporter.${POD_NAME} | POD_NAME: starts with kubernetes-event-exporter-* |
How to view the logs for these components?
There are 2 approaches for this
- Exploration via Log Streams directly: We recommend exploring the logs by directly opening the cloudwatch stream on the Cloudwatch Console. However in some use-cases for API, you could take the benefit of the structured logging.
- E.g you'd want to view the logs for a particular request using the request_id [check next approach]
- Exploration using AWS Cloudwatch Insights: Beneficial for some use-cases in components where structured logging is enabled
- Out of these structured logging is manually supported by DynamoAI for API only
Exploration: AWS Cloudwatch Log Streams
Go to AWS Cloudwatch Console
Steps
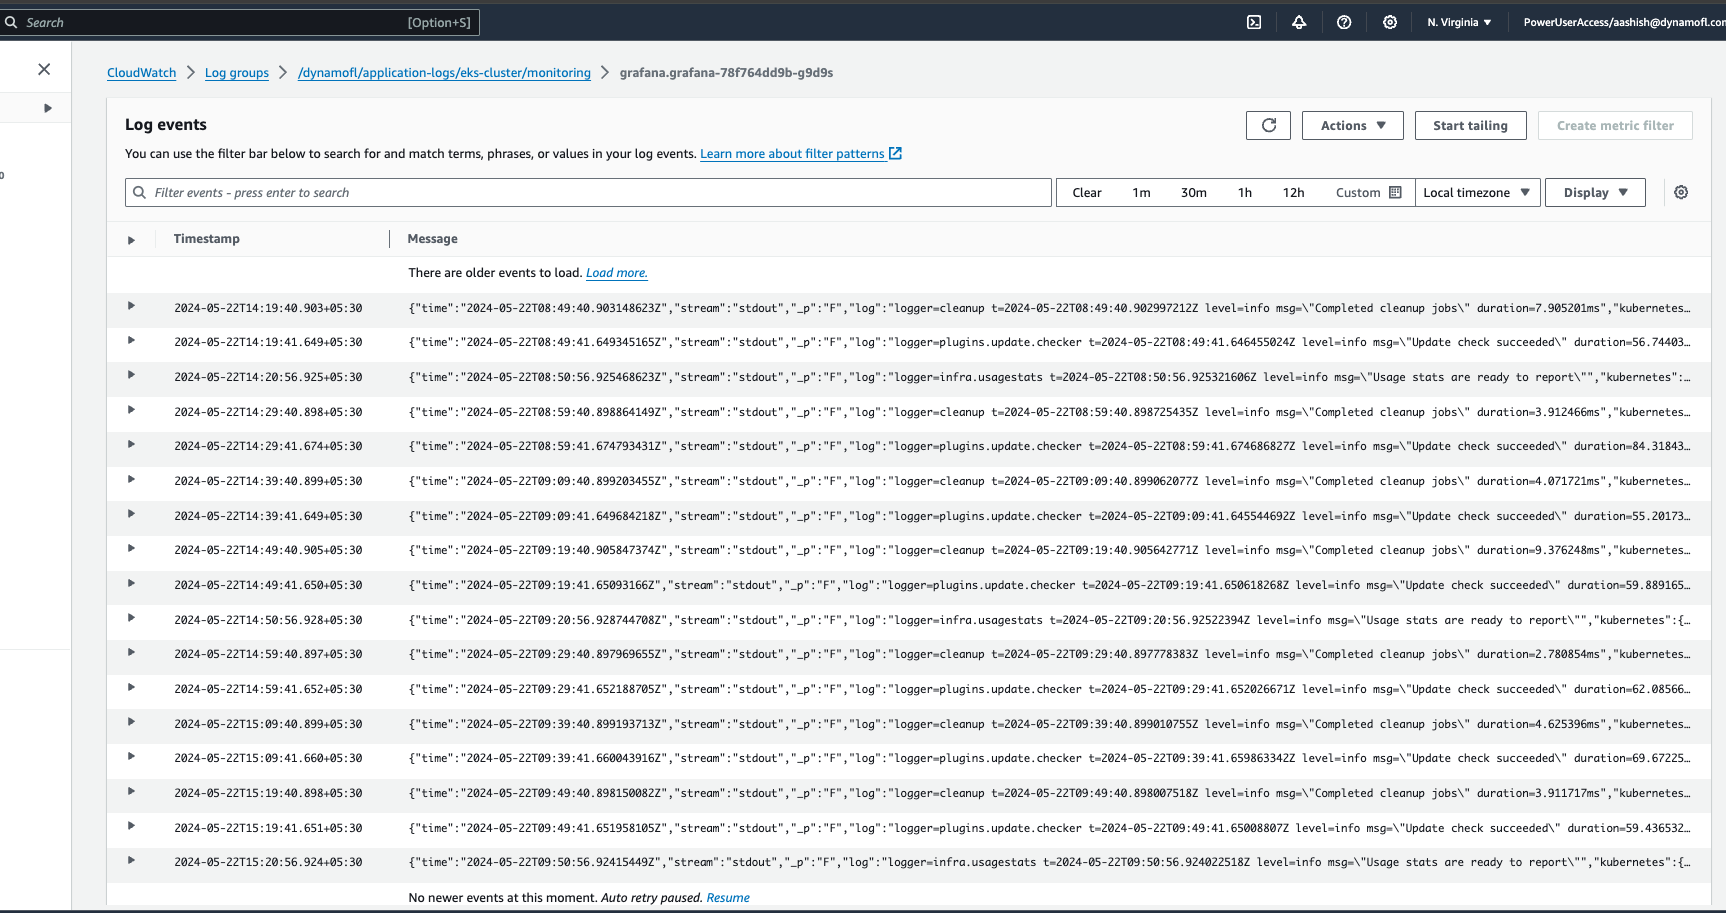
1. Select the log group
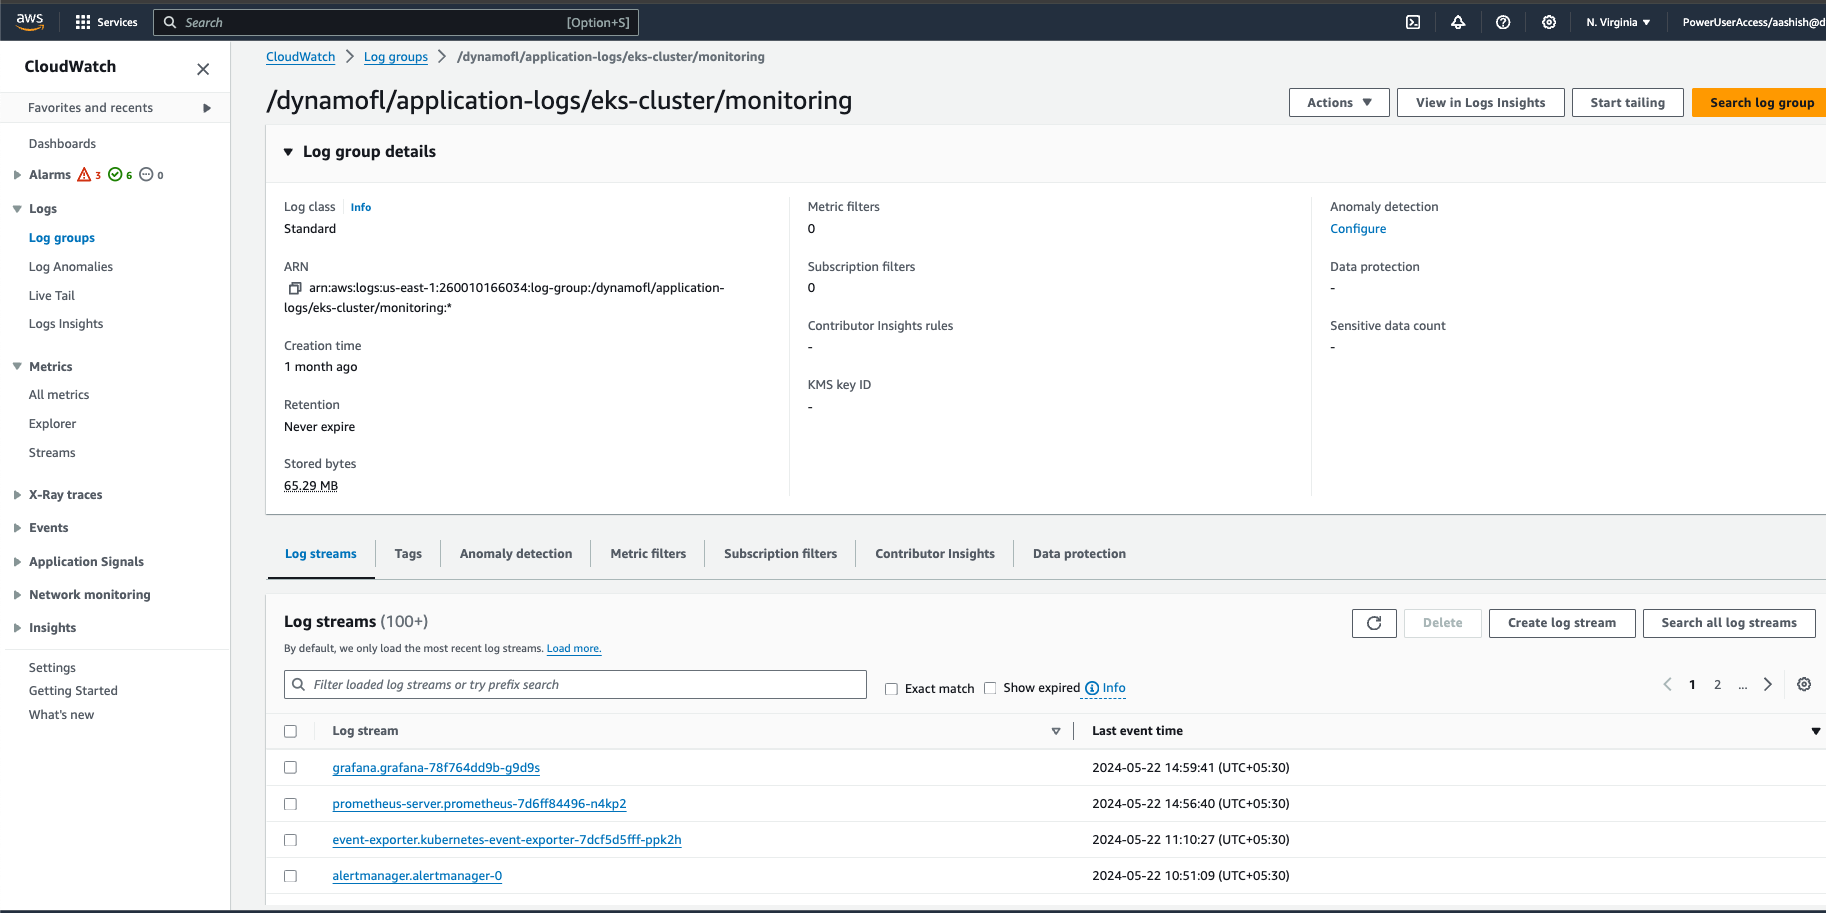
2. Click on the log stream to view the logs
Exploration: AWS Cloudwatch Insights: API
As mentioned before you could use the same approach as exploration via Log Stream for API too. In some use-cases it'll be smart to use this approach.
Structured Logging Attributes: API
| Attribute Name | Value | Logged in every log? | Description |
|---|---|---|---|
| log_proccessed.metadata.component | api | Yes | Fixed value indicating the component associated with the log. |
| log_proccessed.metadata.reqId | Request ID | Yes | The request ID assigned to the incoming request at the API, present in all related logs and returned in the response header as X-Request-Id. |
| log_proccessed.metadata.query | Query Parameters | No, only at entry point | Contains the query parameters for the entry point of the request where the body and query are printed. |
| log_proccessed.metadata.body | Request Body | No, only at entry point | Contains the body of the request payload for the entry point of the request where the body and query are printed. |
Use-Cases: Some of them include when you want
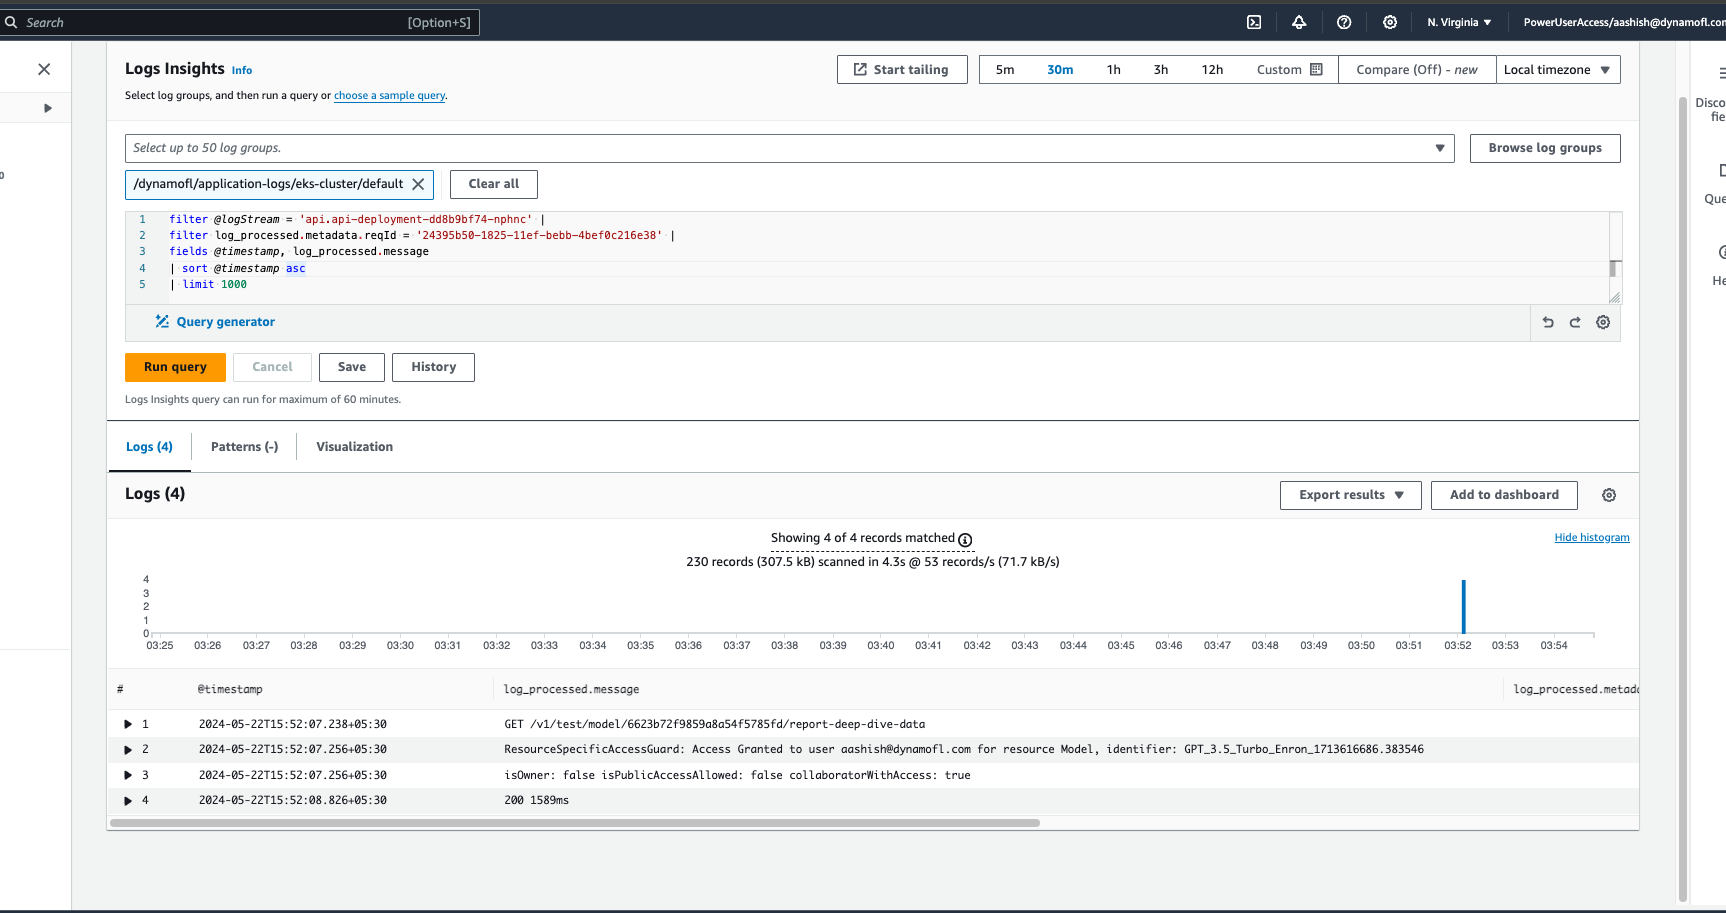
1. To view the logs for a specific request using request id
Query Replace the log stream with your api log stream and the reqId with the request id for which you want to view the logs
filter @logStream = 'api.api-deployment-dd8b9bf74-nphnc' |
filter log_processed.metadata.reqId = '24395b50-1825-11ef-bebb-4bef0c216e38' |
fields @timestamp, log_processed.message
| sort @timestamp asc
| limit 1000
2. To view error logs in the past
Query Replace the log stream with your api log stream
filter @logStream = 'api.api-deployment-dd8b9bf74-nphnc' |
filter log_processed.level = 'error' |
fields @timestamp, log_processed.message
| sort @timestamp asc
| limit 1000
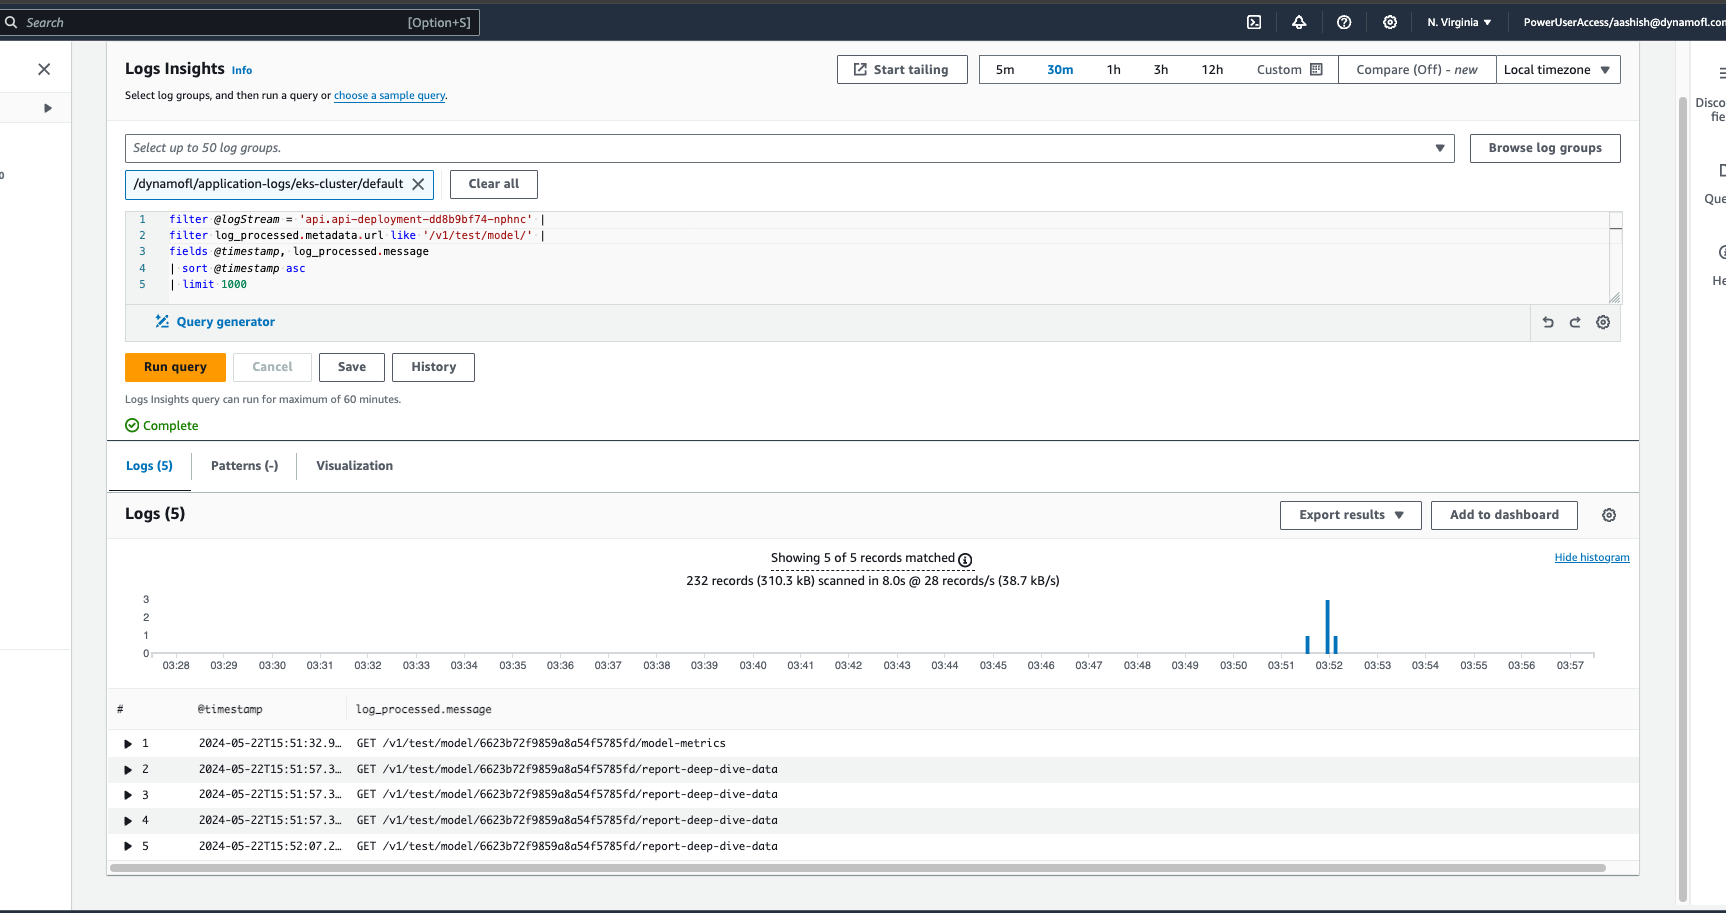
3. Know see the past request entry points for a particular api route
You could use them to know
- The history of such requests being made
- Get the request id for further exploration of the request [by using point 1 listed above]
Query Replace the log stream with your api log stream as well as the url value for whatever api route you want to view the points
filter @logStream = 'api.api-deployment-dd8b9bf74-nphnc' |
filter log_processed.metadata.url like '/v1/test/model/' |
fields @timestamp, log_processed.message
| sort @timestamp asc
| limit 1000