DynamoEval Logs
- DynamoEval request involves logs from the API, attack and the test report generation
- This document would cover how you can view the logs for the DynamoEval attack and the test report generation
Where are we going to view the logs?
- We’re gonna use AWS Cloudwatch Insights as it offers querying with filters over the logs in AWS Cloudwatch
- It allows you to search/filter logs in log groups by using a query
Log Group
In order to use Cloudwatch Insights you need to have the log group within which you're gonna search for the logs
/dynamofl/application-logs/eks-cluster/default- Where
eks-clusteris the cluster name. Most likely it would
- Where
DynamoEval: Attack Logs
Each DynamoEval test has multiple attacks which is executed on a kubernetes pod
Structured Logging Attributes
We've got a fixed set of attributes that are logged with every log in DynamoEval attack log
| Attribute Name | Value |
|---|---|
| log_processed.product | dynamoeval |
| log_processed.component | pentest-attack |
| log_processed.test_id | test id of the test for which the attack is being performed |
| log_processed.attack_id | Id of the attack being performed |
| log_processed.job_id | job id of the attack |
| log_processed.logger | The name of the logger, most likely will be the name of the file. E.g privacy_attacks.pii_leakage.models.huggingLM |
How to view the logs?
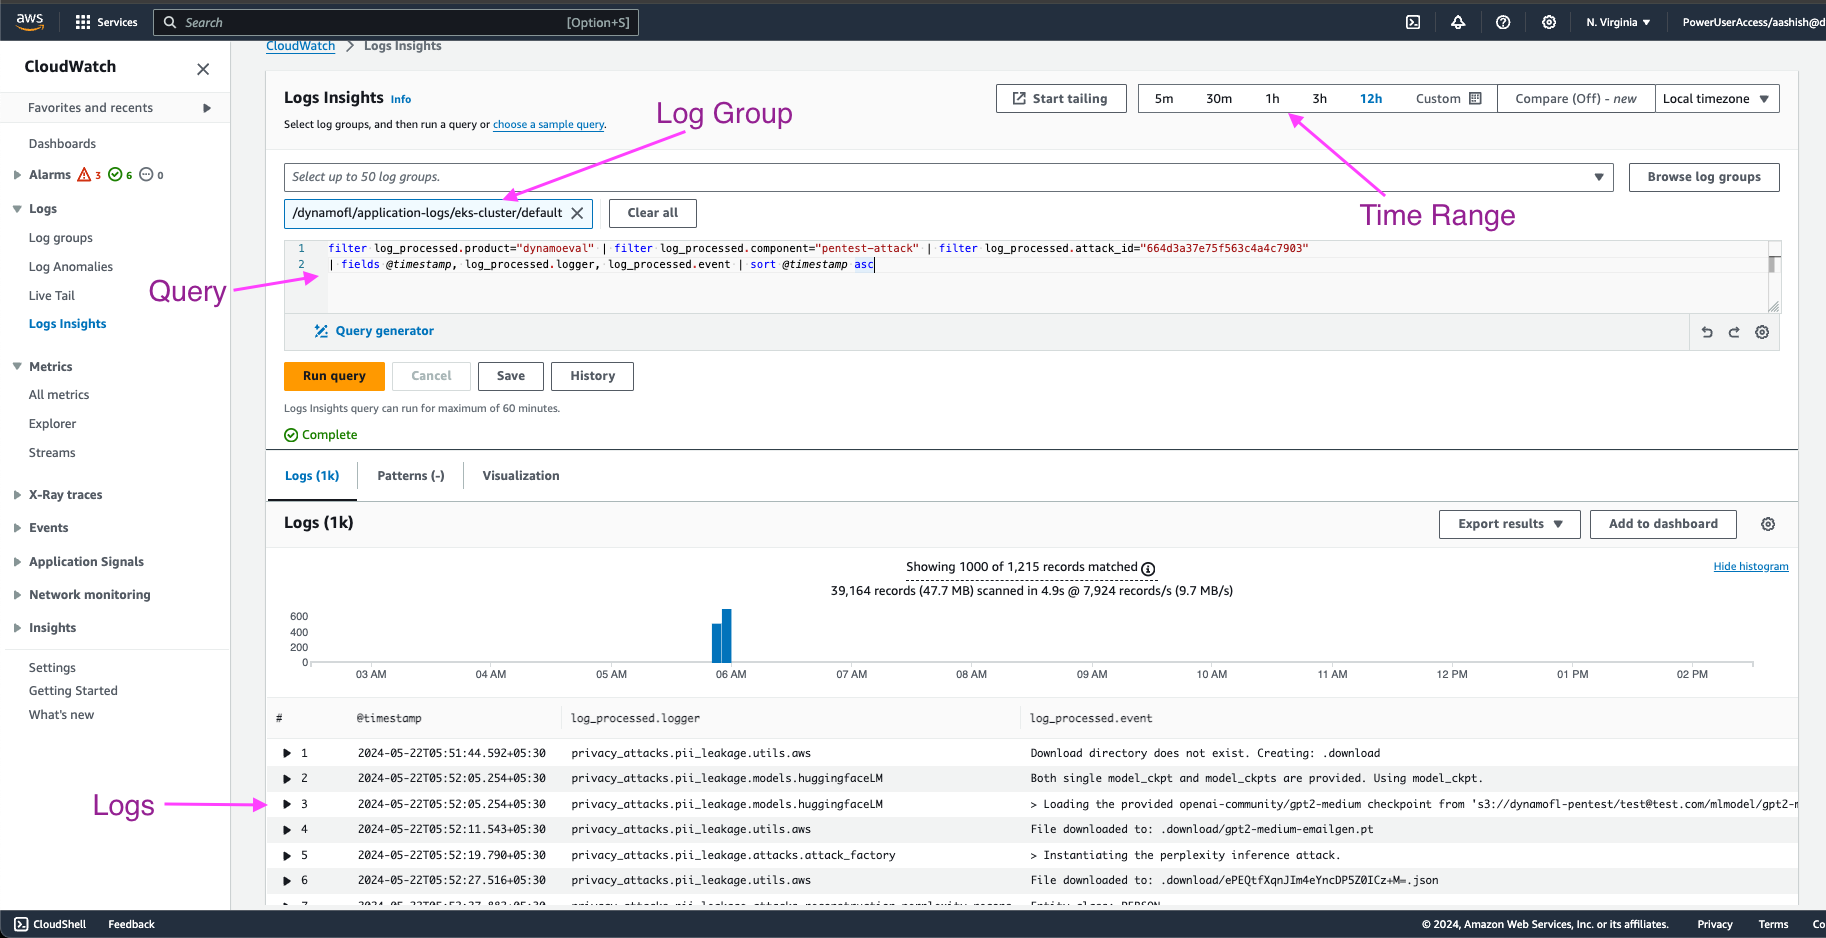
Steps
- Select the Cloudwatch Log Group in the insights dashboard
- Select the time range within which you want to check the logs for
- Run the following query [make sure to replace the value for
log_processed.attack_idin the below query with your attack id]
filter log_processed.product="dynamoeval" | filter log_processed.component="pentest-attack" | filter log_processed.attack_id="664d3a37e75f563c4a4c7903"
| fields @timestamp, log_processed.logger, log_processed.event | sort @timestamp asc
What does it look like?
DynamoEval: Test Report Generation Logs
Some of the DynamoEval tests have a test report generation job that gets executed once the test is finished
Structured Logging Attributes
We've got a fixed set of attributes that are logged with every log in Test Report Generation log
| Attribute Name | Value |
|---|---|
| log_processed.product | dynamoeval |
| log_processed.component | test-report-generation |
| log_processed.test_id | test id of the test for which the attack is being performed |
| log_processed.job_id | job id of the test report generation |
| log_processed.logger | The name of the logger, most likely will be the name of the file. |
How to view the logs?
Steps
- Select the Cloudwatch Log Group in the insights dashboard
- Select the time range within which you want to check the logs for
- Run the following query [make sure to replace the value for
log_processed.test_idin the below query with your test id]
filter log_processed.product="dynamoeval" | filter log_processed.component="test-report-generation" | filter log_processed.test_id="584d3a37a75f463c4a4c0397"
| fields @timestamp, log_processed.logger, log_processed.event | sort @timestamp asc