Visualization
- Capturing metrics is not enough, it's important to have a place where you can immediately go to and watch the trends of the metrics over time
- We ship Grafana configured by default with
- Prometheus instance that has all the metrics as a data source
- Enriched dashboards for different components for exploration of data
- We’ve curated dashboards for analyzing different components of the system
- API
- UI
- MongoDB
- PostgreSQL
- Almost all the dashboards have some of the standard common panels regarding the compute resource, cpu and ram usage, etc.
- These panels will most likely be present in almost every component’s dashboard
- Only RAM Request Utilization and CPU Request Utilization might be missing as in most of the cases these values will be same as the RAM/CPU Limit Utilization as Request and Limit for the resources will be the same
Where can you view the dashboards?
Endpoint
The endpoint can be different in different scenarios
- If ingress enabled
<ui-endpoint>/grafana- E.g
https://staging.dynamofl.com/grafana
- else
- Domain specific in deployment configuration
- E.g
https://grafana.dynamofl.com
Creds
Configured via the deployment config
- Default username:
admin - Password: get it from the deployment team
Grafana: Entry Point
Click on Dashboards on the left menu panel and you should be able to see the list of the dashboards
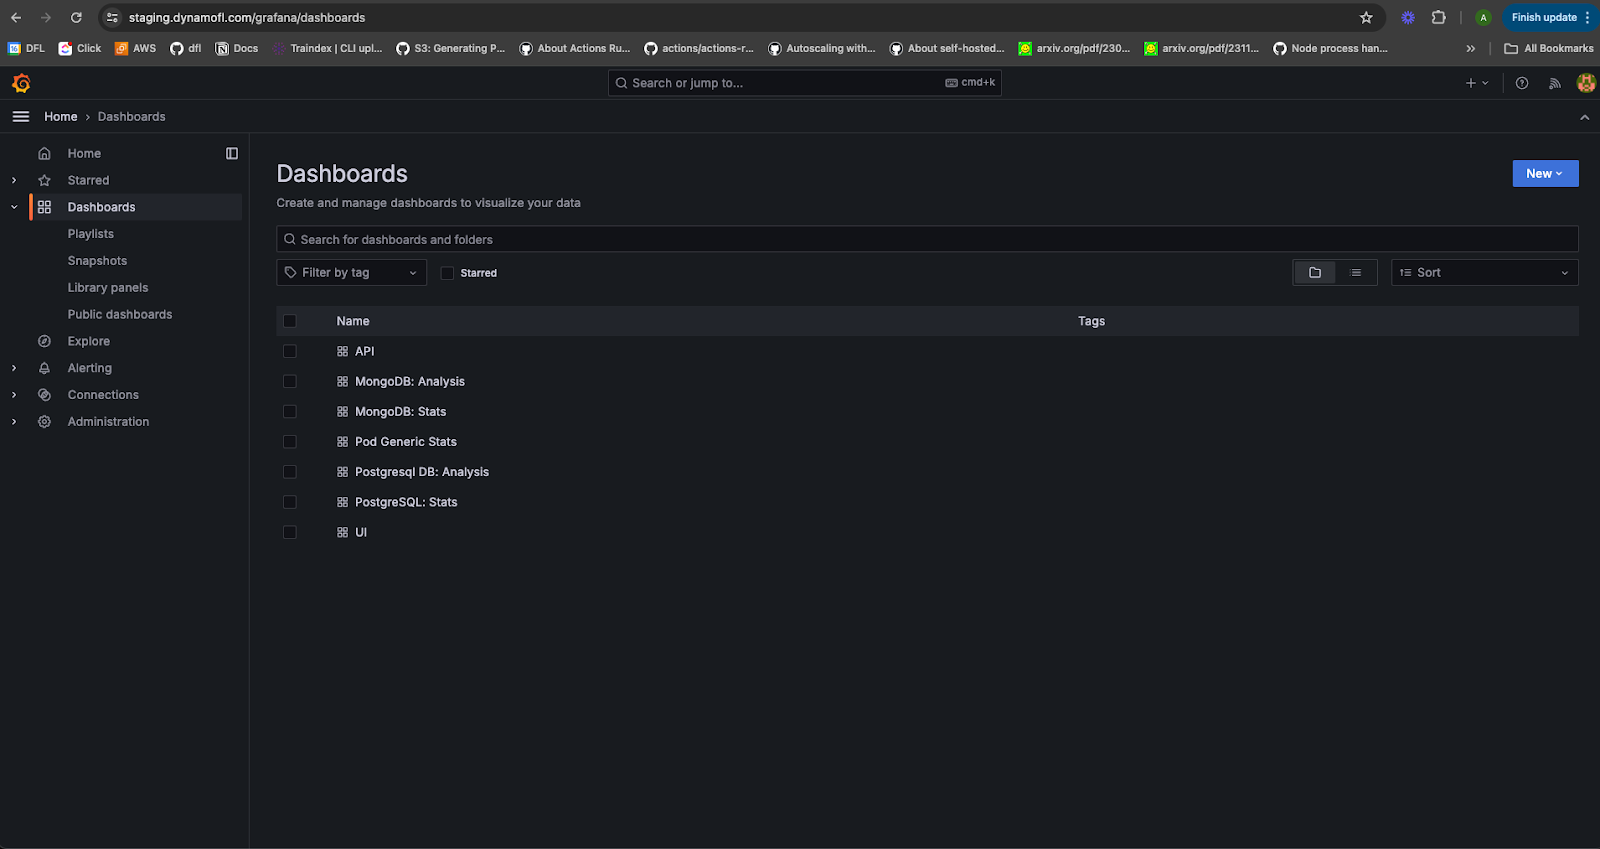
Dashboards
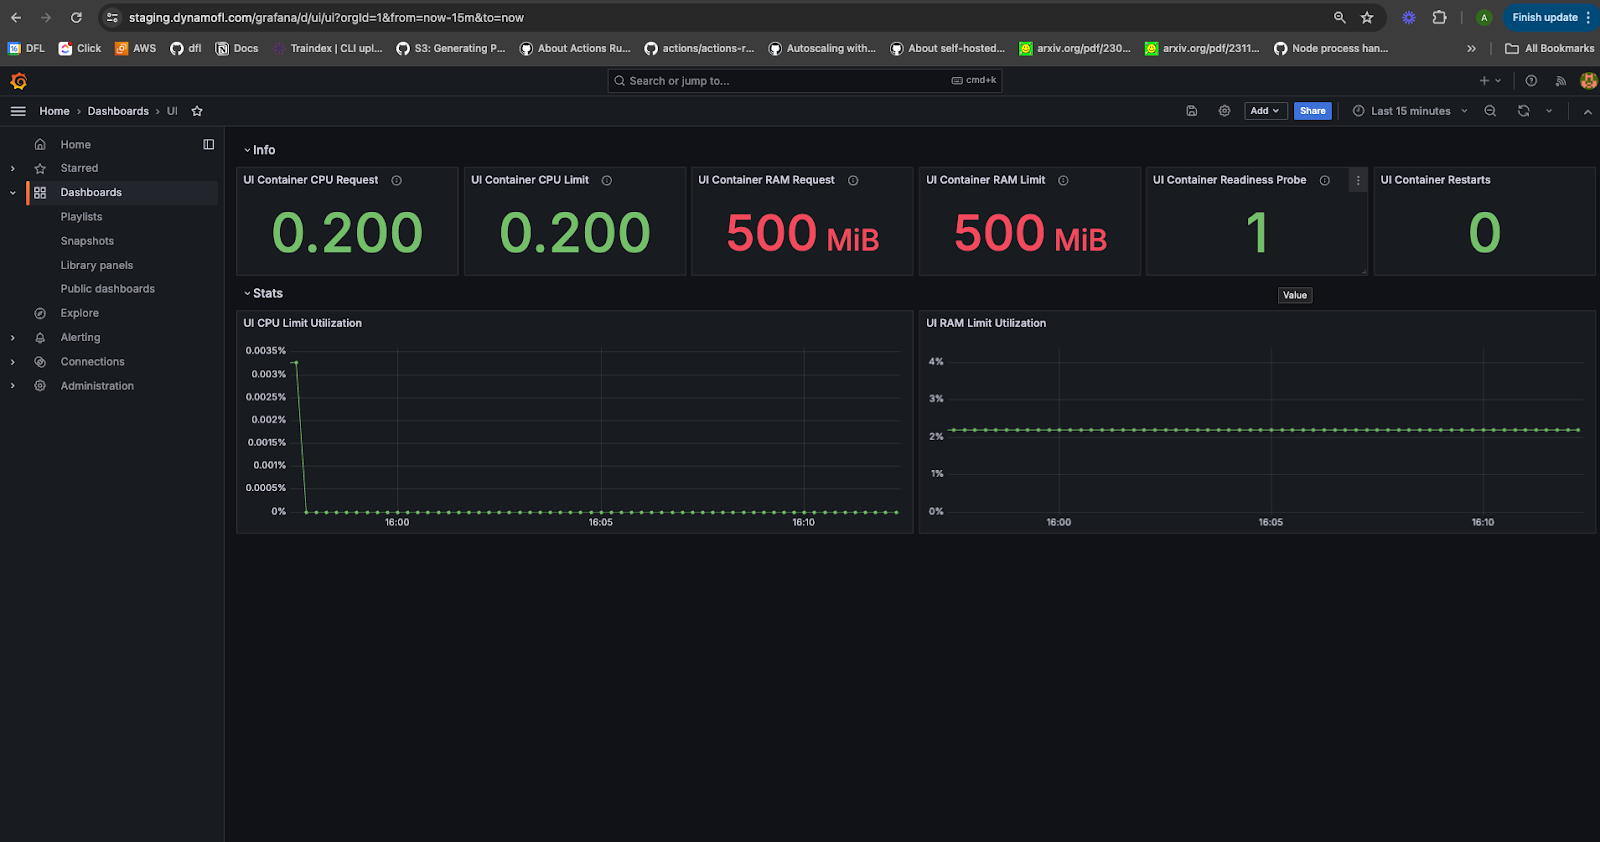
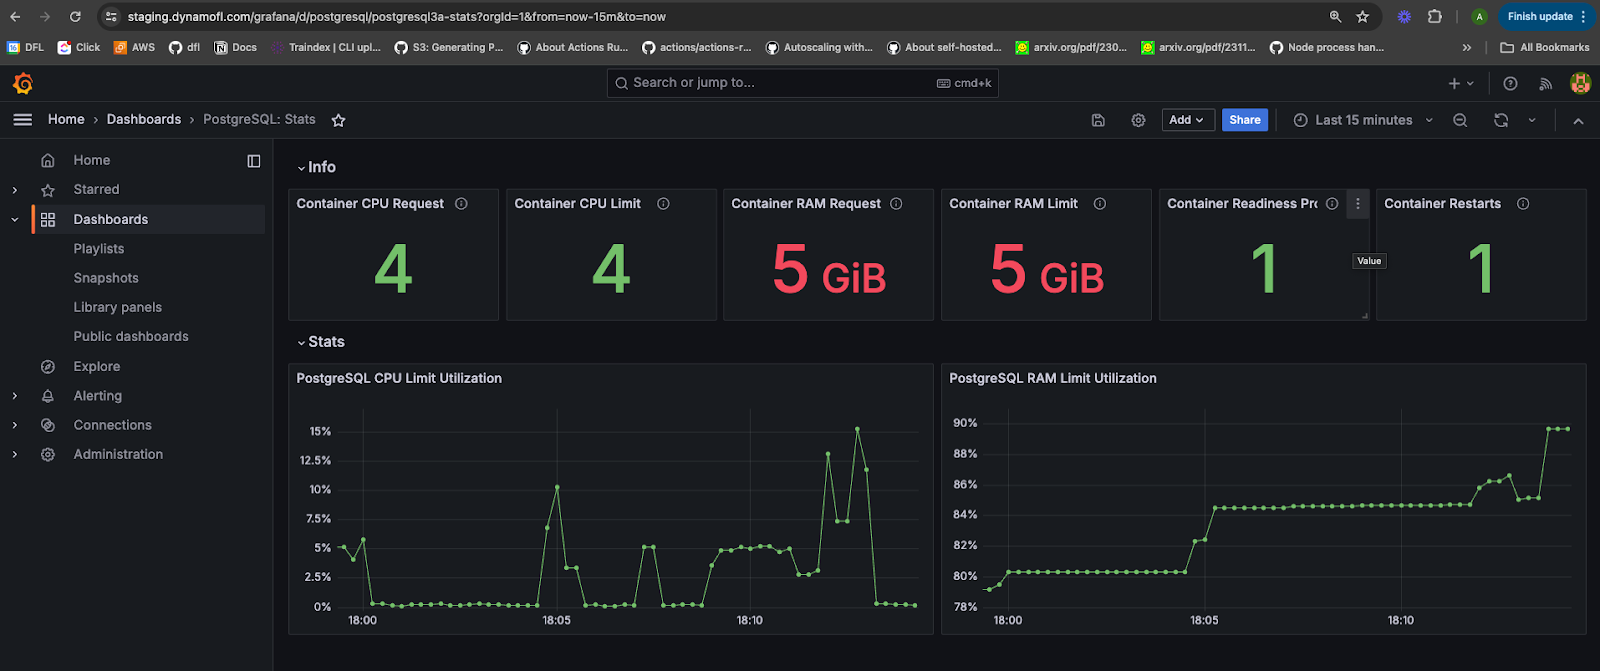
Common Panels
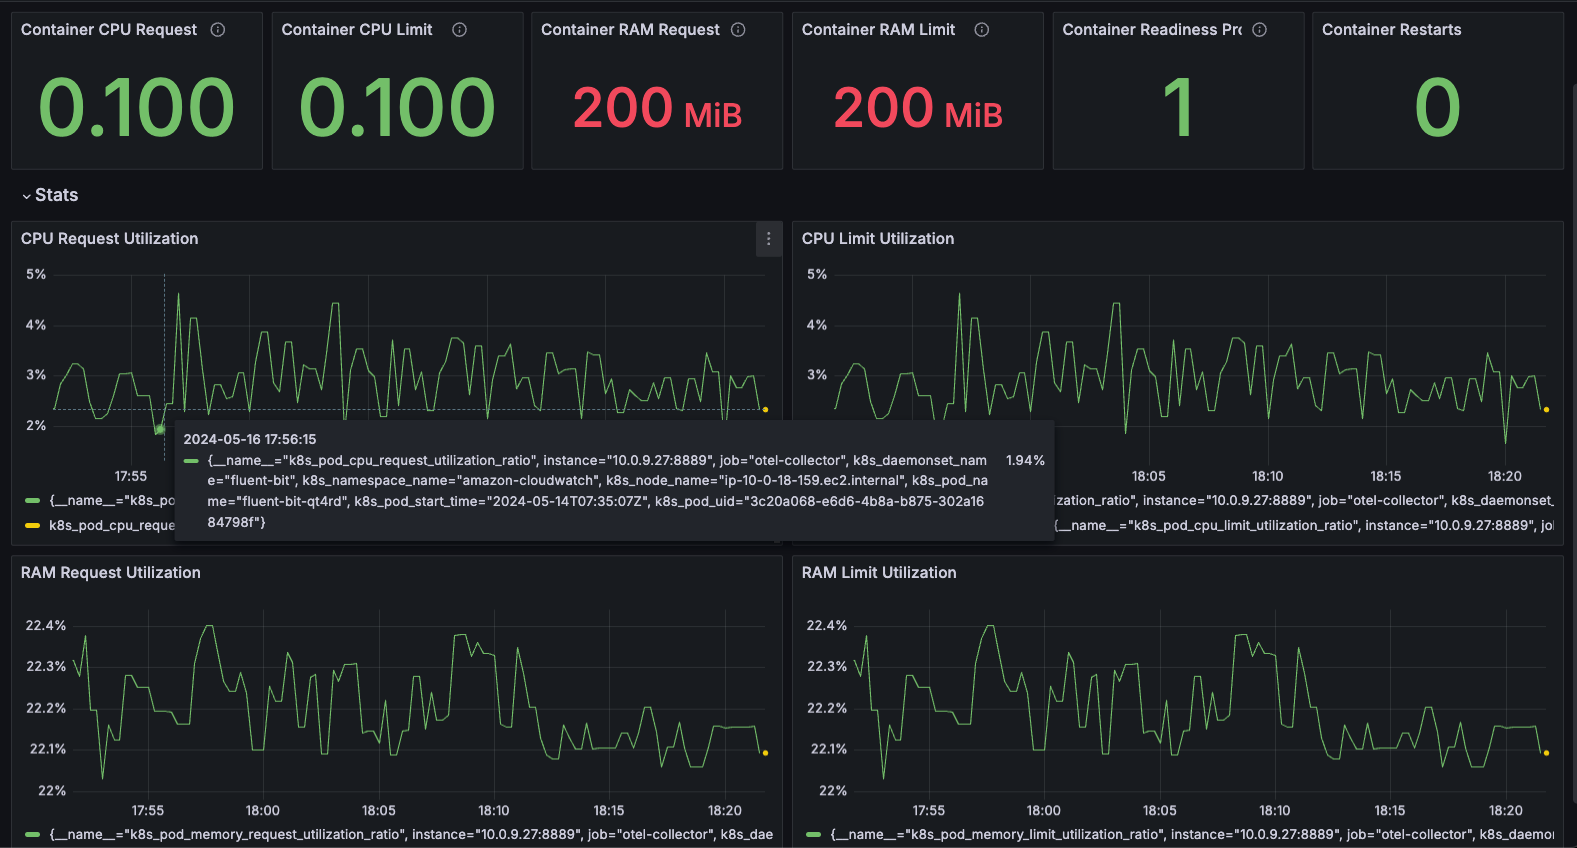
Breakdown
| Panel Name | Description |
|---|---|
| Container CPU Request | The CPU Request requested by the resource’s container |
| Container CPU Limit | The CPU Limit requested by the resource’s container |
| Container RAM Request | The RAM Request requested by the resource’s container |
| Container RAM Limit | The RAM Limit requested by the resource’s container |
| Container Readiness Probe | Whether the container is ready or not (1 means yes, 0 means no) |
| Container Restarts | Number of times the container has restarted |
| RAM Request Utilization | % of RAM utilized wrt the Request requested for the container |
| RAM Limit Utilization | % of RAM utilized wrt the Limit requested for the container |
| CPU Request Utilization | % of CPU utilized wrt the Request requested for the container |
| RAM Limit Utilization | % of RAM utilized wrt the Limit requested for the container |
API
Common Panels
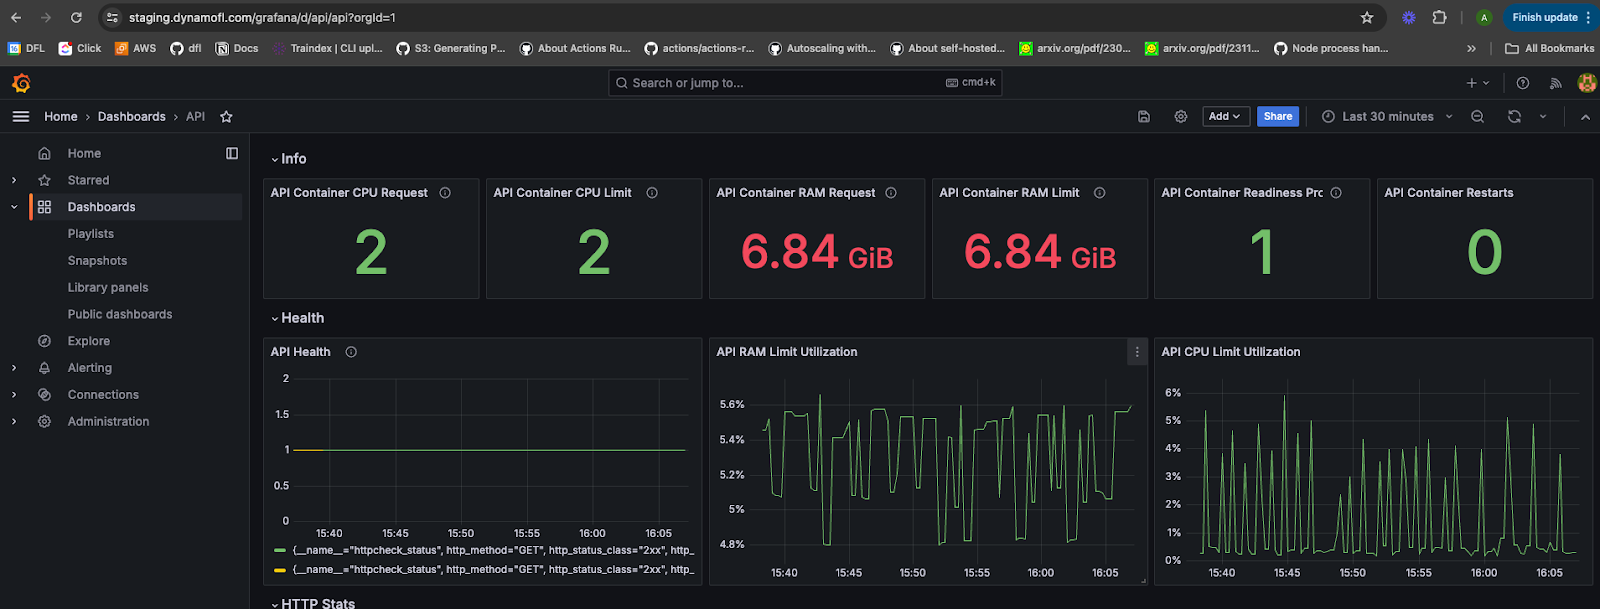
HTTP Stats
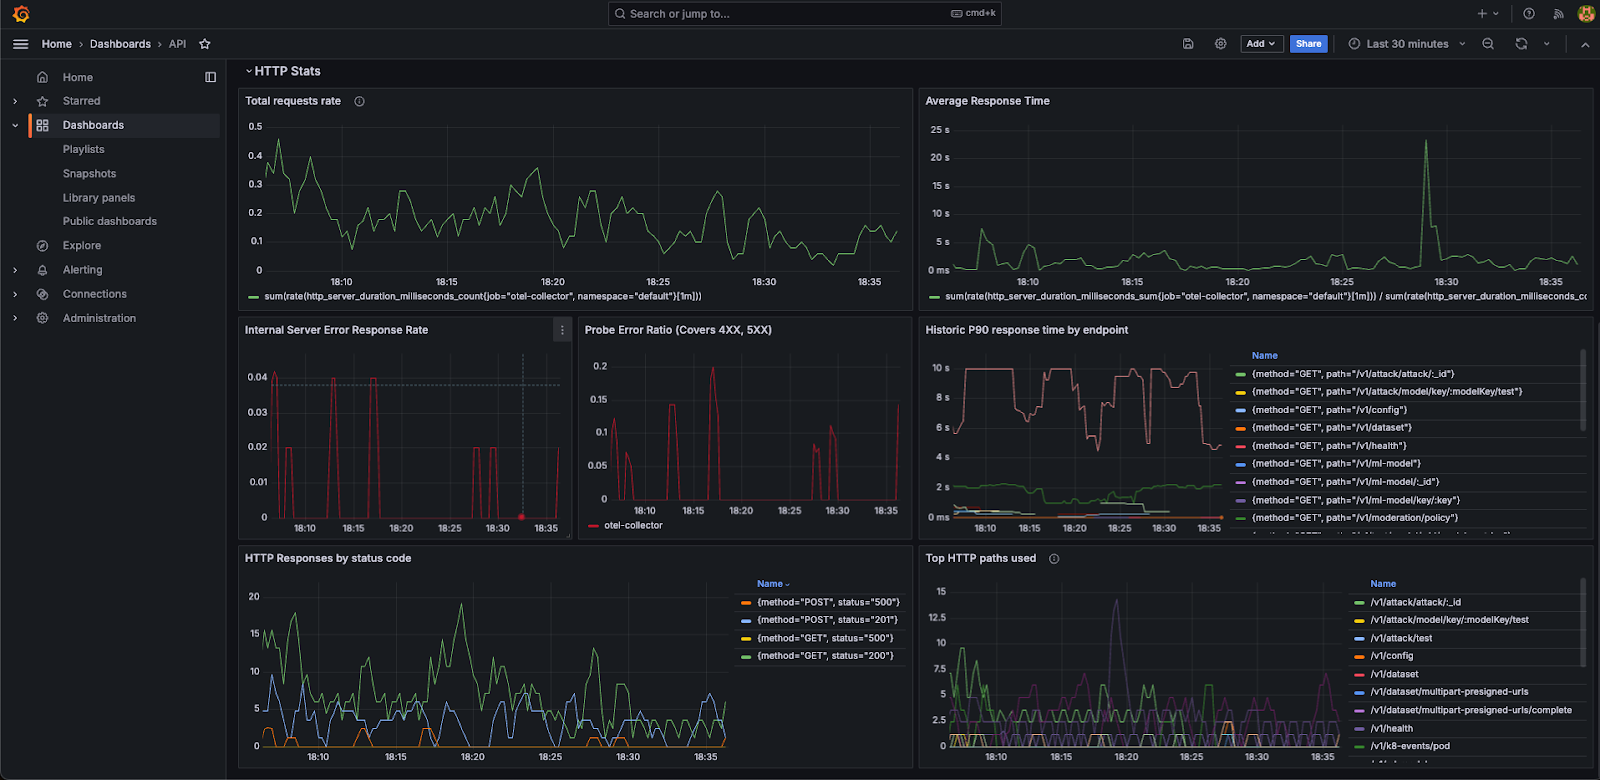
Panel Breakdown
| Panel Name | Description |
|---|---|
| API Health | Health of the API. If 1 that means it’s healthy, else it’ll be 0 |
| Total Requests Rate | Rate of total requests |
| Average Response Time | Average response time across all endpoints |
| Internal Server Error Response Rate | Requests with internal server error / Total requests |
| Probe Error Ratio | Requests with errors of 4xx, 5xx / Total requests |
| Historic P90 response time by endpoint | P90 response time by different endpoints of the API |
| HTTP Responses by status code | HTTP responses over time with a given status code |
| Top HTTP Paths used | Number of HTTP requests by path over time |
UI
It only has the common panels
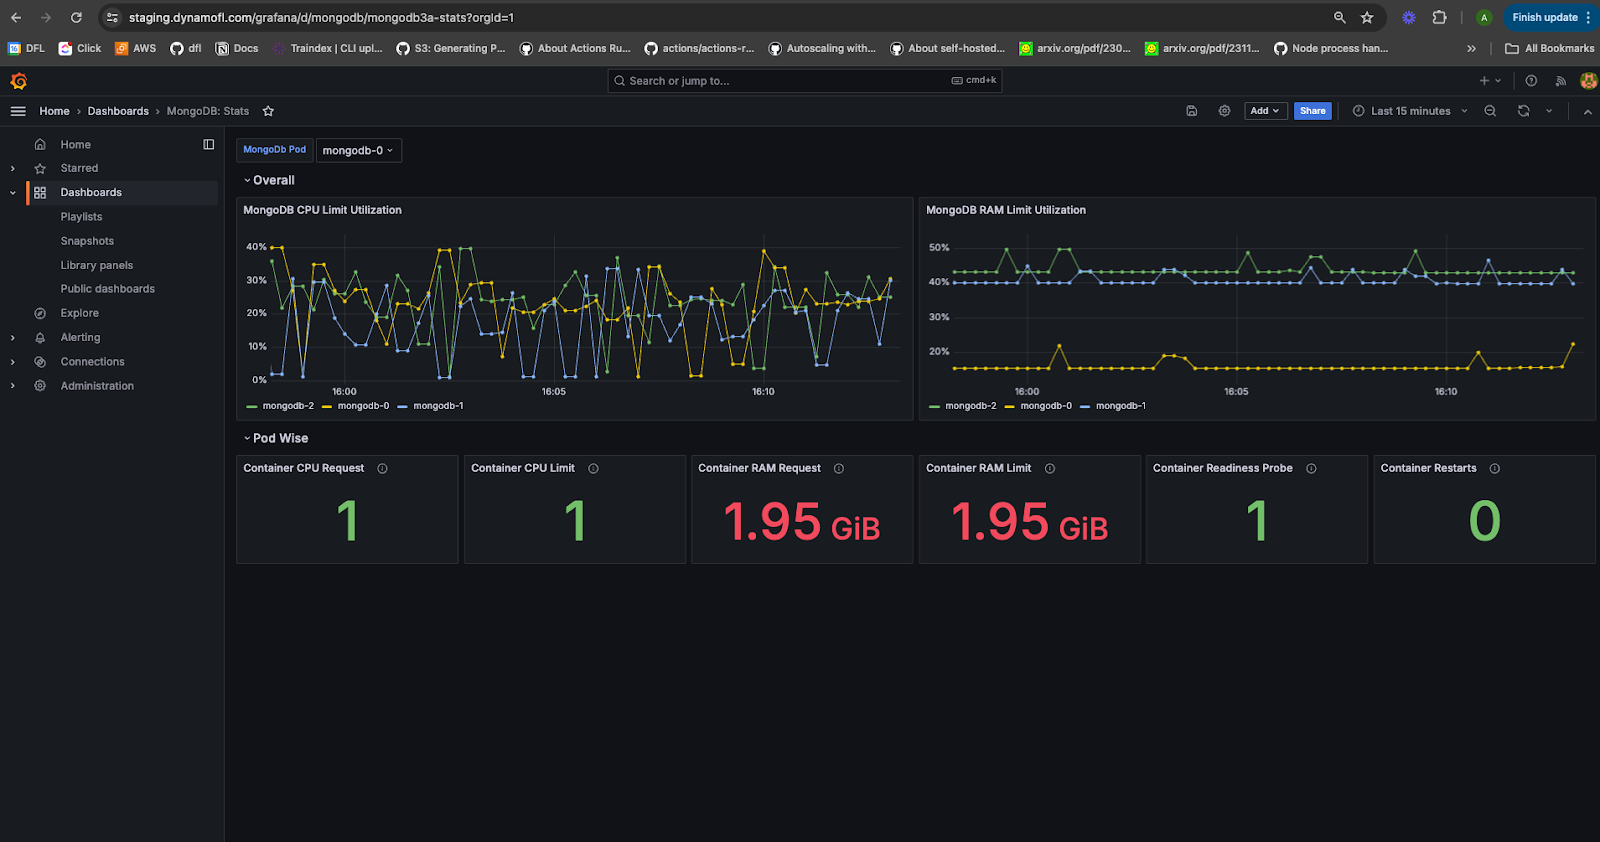
MongoDB Stats
This covers the generic information captured from the kubernetes cluster about the mongodb deployment
Panels Breakdown
Overall Row
- Contains the CPU & RAM Limit Utilization panels Pod Wise Row
- Since MongoDB is deployed as a replicaset you can choose the pod for which you want to view the common pod wise information
- There is MongoDB Pod variable at the top to choose the pod name from
MongoDB Analysis
This is where you can see the panels that contain information obtained by querying the MongoDB database
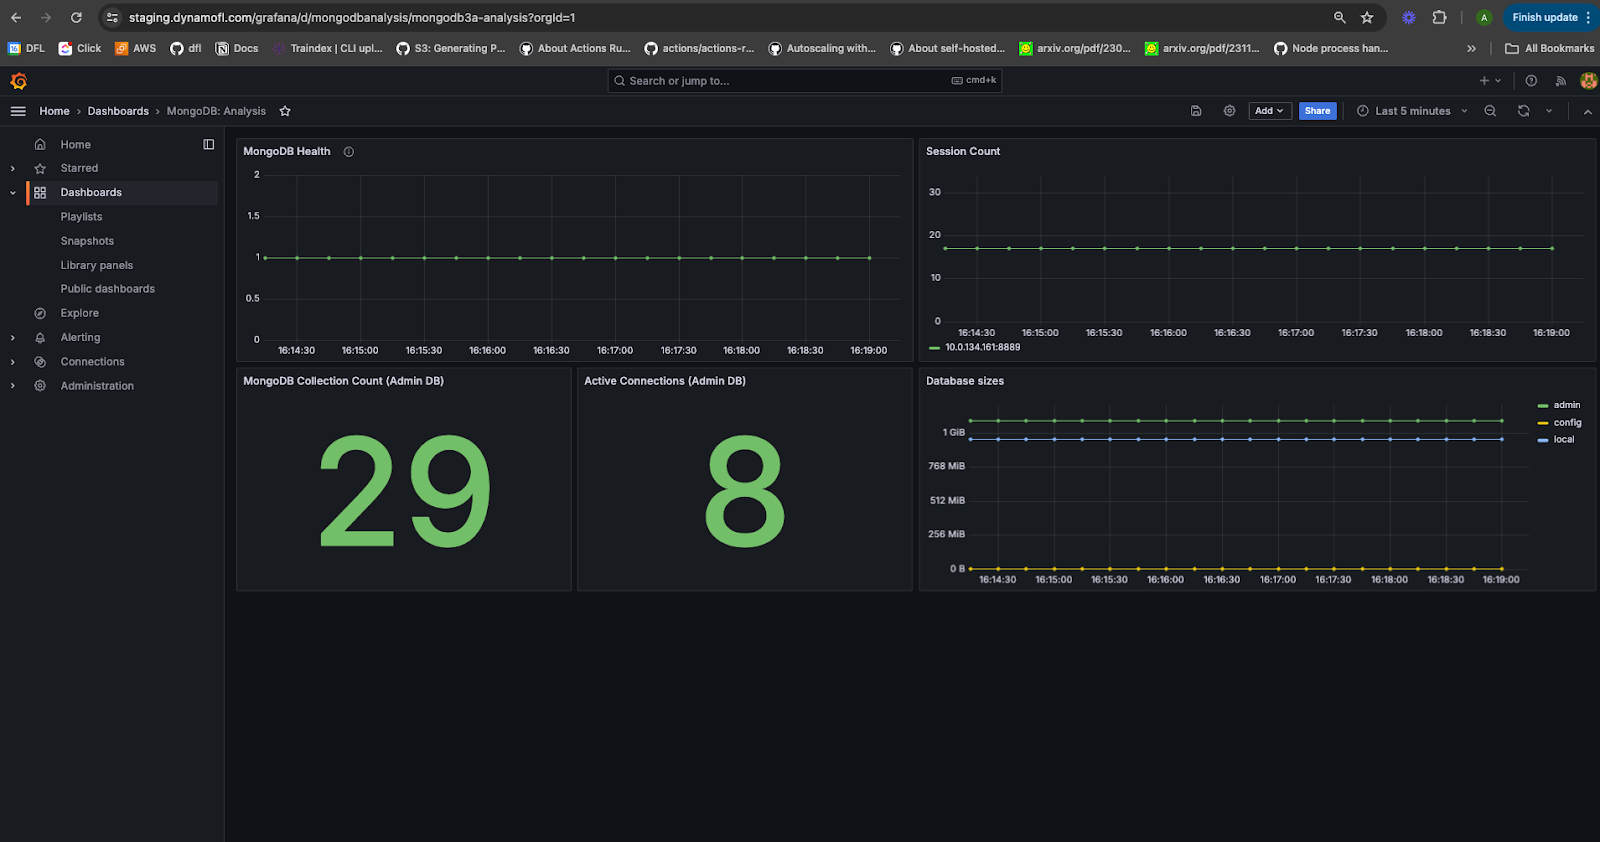
Panels Breakdown
| Panel Name | Description |
|---|---|
| MongoDB Health | Health of MongoDB. If 1 that means it’s healthy, else it’ll be 0 |
| Session Count | Number of sessions over the course of time |
| Collection Count (Admin DB) | Total number of collections present in MongoDB for admin database |
| Active Connections (Admin DB) | Total number of active connections at the moment in MongoDB for admin database |
| Database Sizes | Size of the databases in MongoDB over the course of time |
PostgreSQL Stats
This covers the generic information captured from the kubernetes cluster about the PostgreSQL deployment
PostgreSQL Analysis
This is where you can see the panels that contain information obtained by querying the Postgresql databas
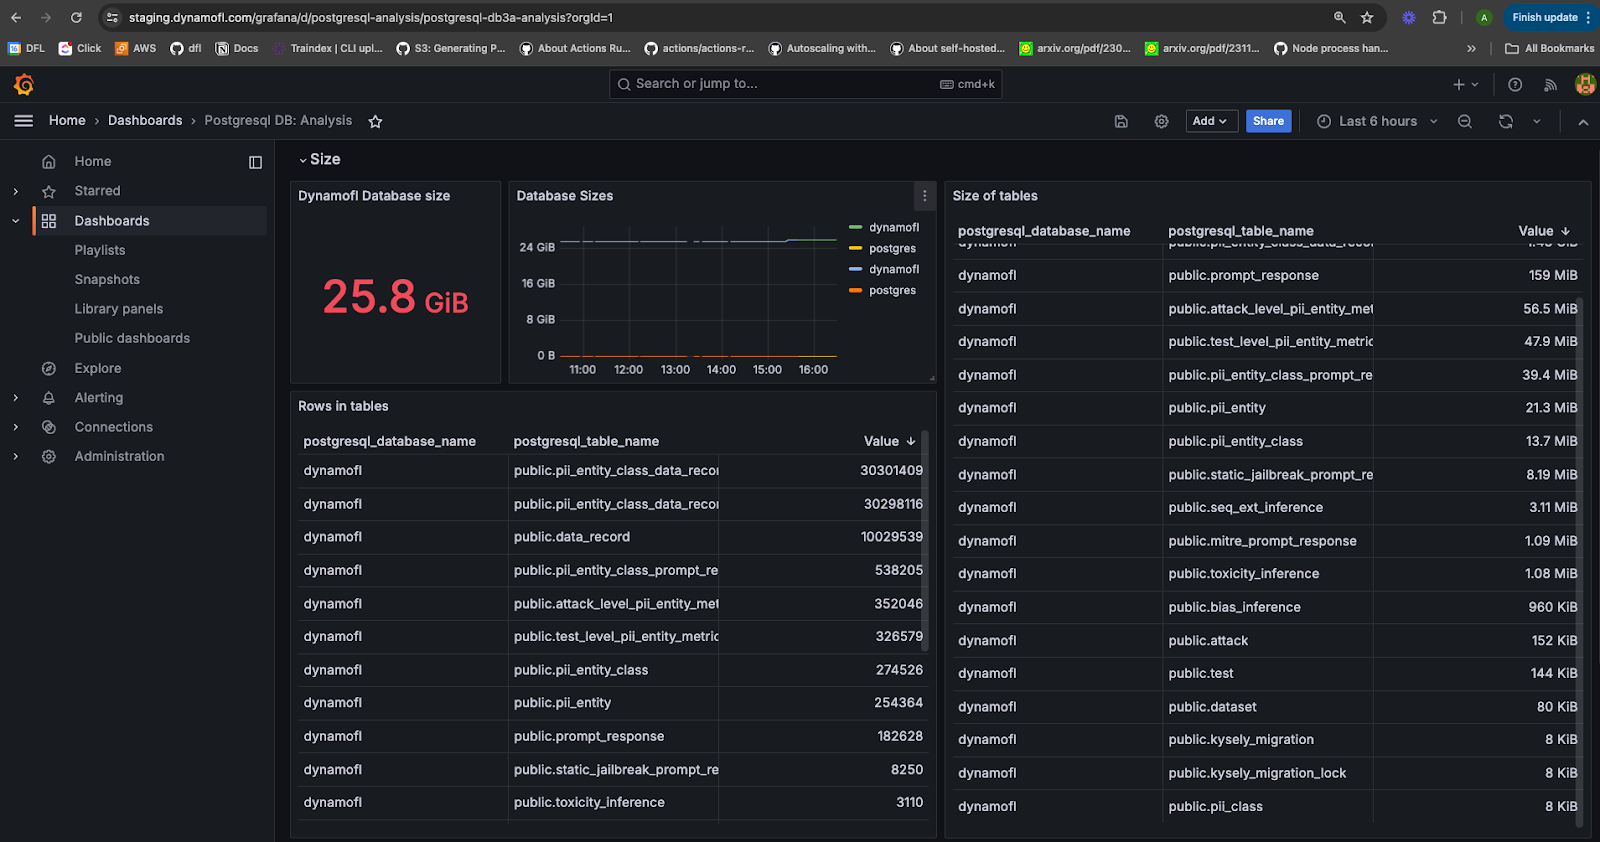
Panels Breakdown
| Panel Name | Description |
|---|---|
| DynamoAI Database size | Total size of the dynamofl database |
| Database sizes | Size of the different databases in PostgreSQL over time |
| Size of tables | Size of the tables in the database |
| Rows in tables | The number of rows in the dynamofl database’s tables |
| Database Sizes | Size of the databases in MongoDB over the course of time |
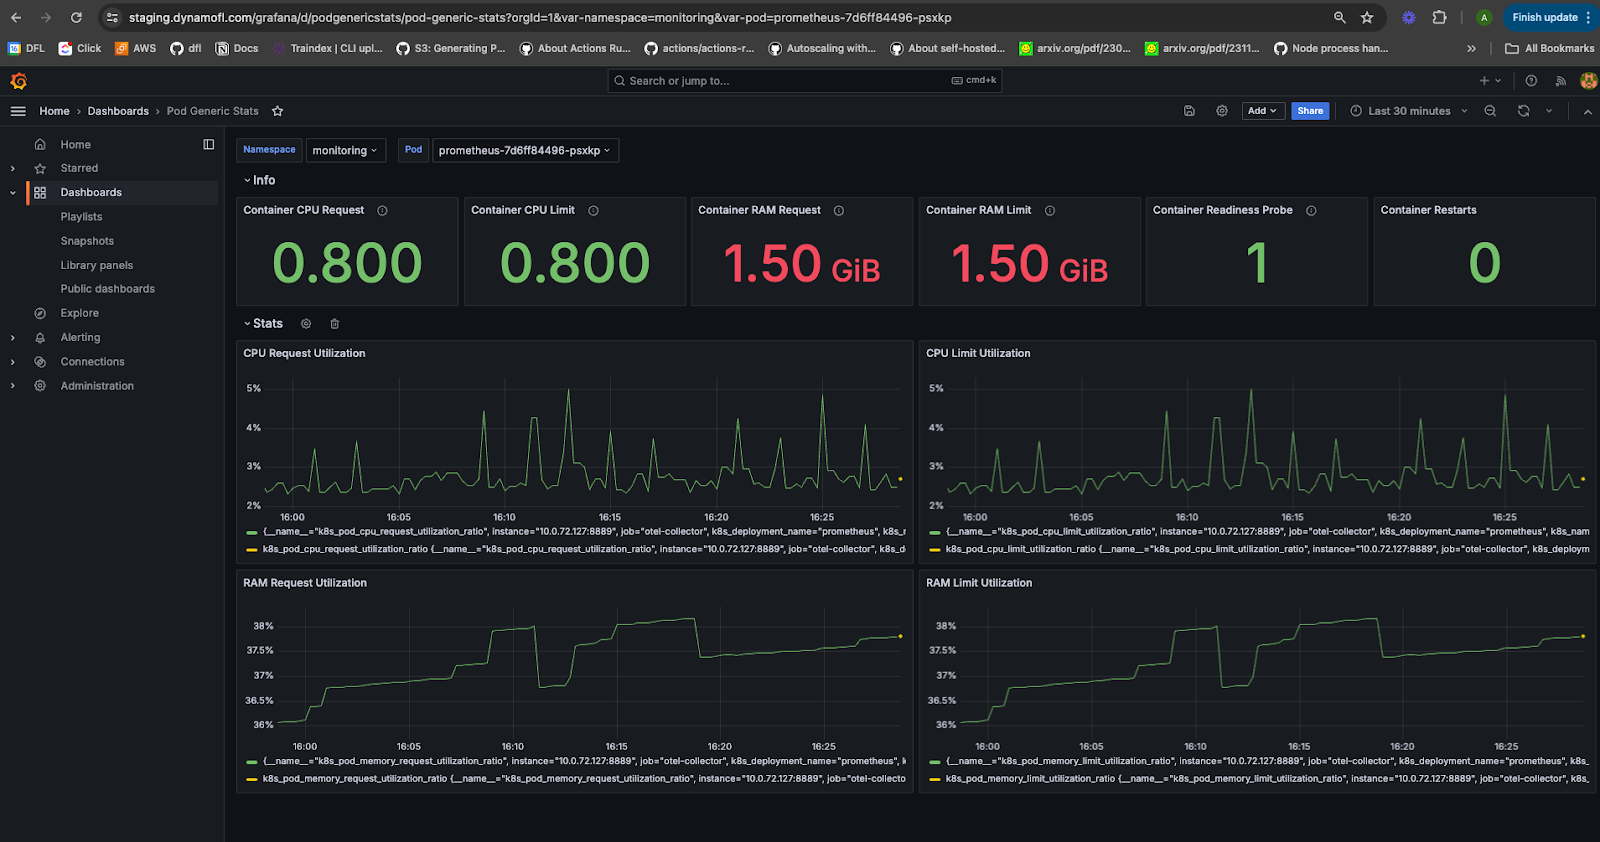
Pod Generic Stats
- This allows you to view the common panel information mentioned in the overview for any pod in the kubernetes cluster
- You can choose the namespace and then the pod from the list of pods present in that namespace using the select list at the top left corner of the dashboard